
Efficiency decisions fall apart when they are built on guesses. “This old fridge must be expensive” and “the TV barely uses anything off” are both testable claims, and a plug-in watt meter tests them for a few dollars. It sits between an outlet and a device and reports exactly what that device draws — in watts right now and in kilowatt-hours over time.
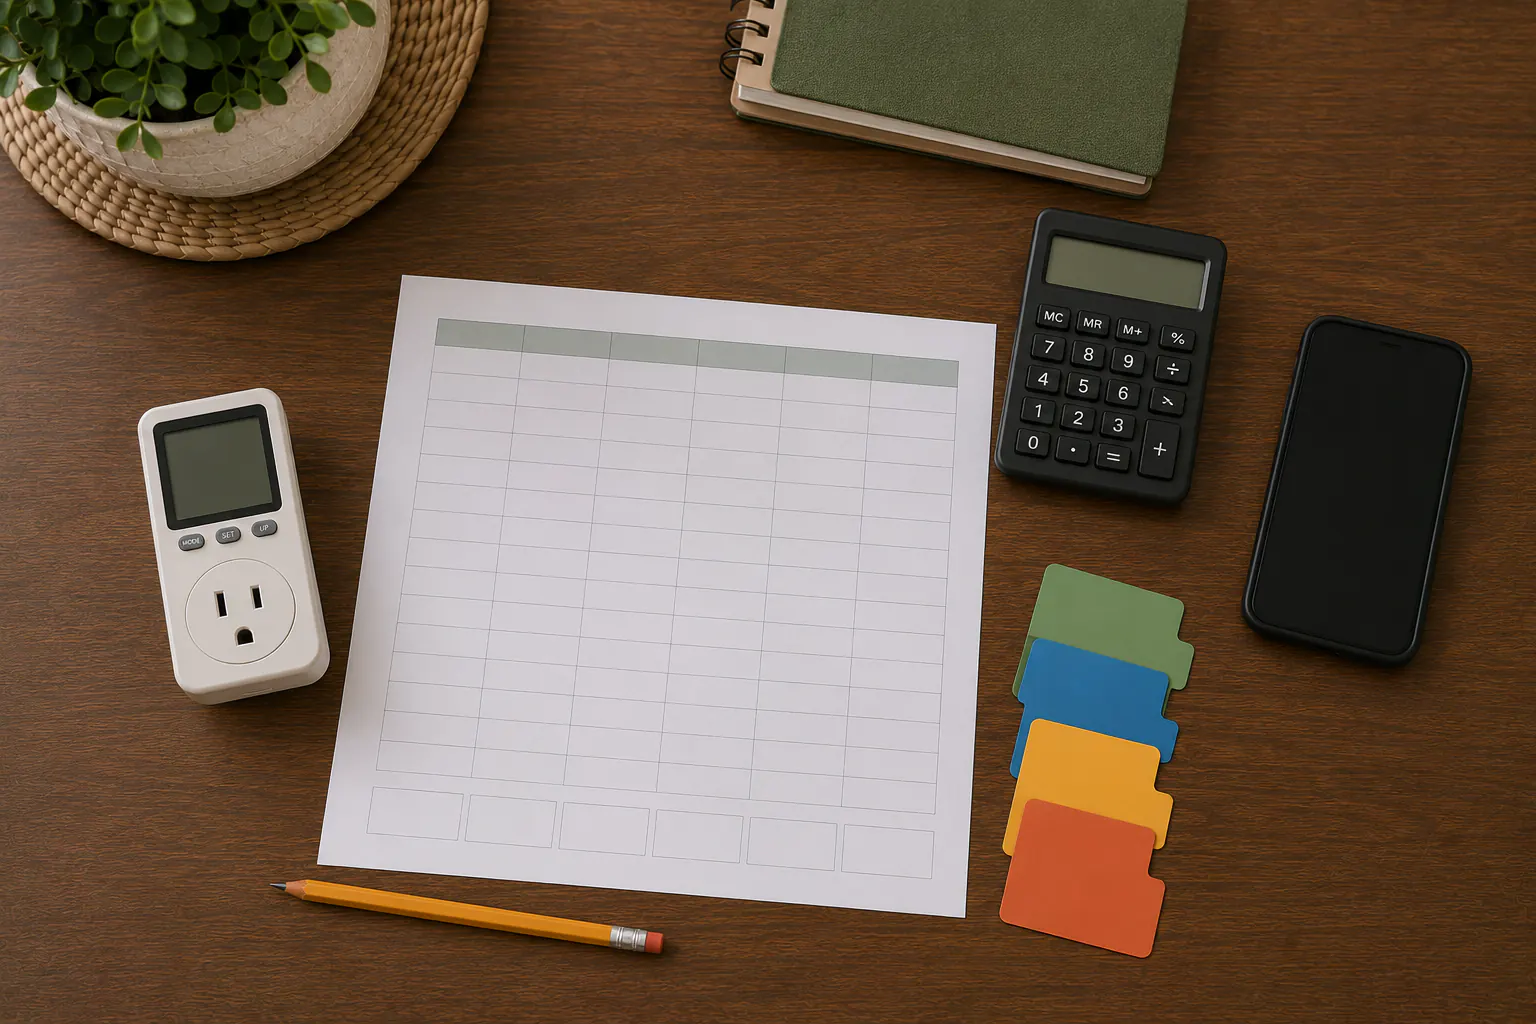
This is the tool that turns the rest of the home energy efficiency cluster from opinion into data. DOE explicitly recommends measuring actual use because nameplate ratings often describe a maximum rather than normal consumption. (Source: U.S. Department of Energy, Estimating Appliance and Home Electronic Energy Use.)
What a plug-in meter can and cannot do
A plug-in meter measures standard 120-volt plug loads — the things you plug into a normal wall outlet. That covers most of what you would investigate: refrigerators, TVs, computers, chargers, microwaves, window air conditioners, and entertainment clusters.
It cannot measure:
- 240-volt appliances (electric dryers, ranges, some large air conditioners) — these use a different outlet and must never be adapted onto a 120-volt meter;
- hardwired equipment (furnaces, water heaters, built-in ovens);
- whole-house or circuit-level use.
For those, you need a whole-home energy monitor installed at the panel by a qualified electrician, or you rely on the equipment’s own ratings. The research-only home energy monitor comparison covers that class of device. A plug-in meter also does not test electrical safety — for damaged cords or outlets, see inspecting outlets, plugs, and power strips.
Read the two numbers that matter
Meters vary, but almost all show these:
- Watts (W). Instantaneous power draw. Useful for seeing the difference between a device in use, idle, and standby.
- Kilowatt-hours (kWh). Cumulative energy over the time the meter has been recording. This is what your utility bills, so it is the number for cost.
Many meters also let you enter your electricity rate ($/kWh, found on your bill) and will display accumulated cost directly.
Step-by-step measurement
- Plug the meter into the wall, then plug the device into the meter. Make sure the device’s own plug is fully seated.
- Read the instantaneous watts in each state you care about:
- In active use (TV playing, fridge compressor running)
- Idle but on
- “Off” but still plugged in — this is the standby draw
- Leave it recording for a representative period. For anything that cycles — refrigerators, freezers, heating and cooling — a single watt reading is misleading because the compressor turns on and off. Let the meter accumulate kWh for at least 24 hours, ideally a few days, to capture real duty cycles.
- Record kWh and elapsed time, then extrapolate.
Turn a reading into annual cost
For a steady load, use the watts:
watts × hours per day × 365 ÷ 1,000 = kWh per year
For a cycling load, use the accumulated meter reading instead, which already averages the on/off cycles:
kWh measured ÷ days measured × 365 = kWh per year
Multiply kWh per year by your rate for annual cost. A refrigerator that logs 3 kWh over 24 hours is on track for about 1,095 kWh per year — a real, comparable figure you can weigh against a new efficient model.
Catch the standby surprises
Metering is the honest way to size standby waste, which DOE estimates at 5% to 10% of residential energy use across a home. (Source: U.S. Department of Energy, 3 Easy Tips for Reducing Your Standby Power Loads.) Measure each cluster in its “off” state:
- A set-top box or old game console that idles nearly as high as it runs
- An entertainment center that never truly powers down
- A printer or external drive holding a small constant draw
When a manufacturer does not publish an idle figure, the Lawrence Berkeley National Laboratory standby-power reference gives typical measured values to sanity-check yours. (Source: Lawrence Berkeley National Laboratory, Standby Power.) Use the results to build the switch-off list in the phantom loads guide.
Build a load list for backup power
Metering does double duty. The same measured watts that reveal waste also feed an honest backup-power plan. Nameplate labels overstate normal draw, so a plan built on them oversizes some loads and undersizes surge on others.
Record measured running watts, idle watts, and — where a device cycles — average watts over time. Drop those into the backup power load worksheet so your battery or generator sizing rests on measurement, not marketing. When the power is out and you are reducing load to stretch backup, that measured list tells you exactly which devices to cut first.
Make sense of confusing readings
A meter is only useful if you interpret it correctly. A few readings surprise people:
- A fluctuating number is normal. Motors, compressors, and anything with a heating element vary as they cycle. Watch the pattern rather than a single instant, and trust the accumulated kWh for cost.
- A brief spike at startup is real. Refrigerators, pumps, and some power tools draw a short surge when the motor starts. That surge matters for backup-power sizing even though it barely affects the energy total — note it separately.
- “Off” that is not zero is the point. If a device reads a few watts while switched off, you have measured its standby draw directly. That is exactly the waste the phantom loads guide targets.
- Very low readings can hit meter limits. Inexpensive meters lose accuracy at the bottom of their range, so a device drawing under a watt or two may read imprecisely. Use the accumulated kWh over a longer window instead of a tiny instantaneous figure.
Prioritize what to measure first
You do not need to meter everything. Spend your time where the money is:
- Anything old and always on — a second refrigerator or freezer, an aquarium, a sump or well pump.
- Entertainment and office clusters, where standby waste concentrates.
- Seasonal heavy hitters — window air conditioners and space heaters — measured in the season they run.
- Any appliance you suspect is failing, since a struggling compressor or motor often draws more than a healthy one and shows up as a rising kWh reading over time.
Measuring the top of that list captures most of the savings for a fraction of the effort. Feed the results into your DIY energy audit findings so the audit rests on numbers, not hunches.
A simple measurement log
Keep one sheet per household:
| Device | Watts in use | Watts idle | Watts standby | kWh/day (metered) | Est. kWh/year | Notes |
|---|---|---|---|---|---|---|
| Refrigerator | — | — | — | measure over 24h+ | — | Cycles; use metered kWh |
| Entertainment cluster | — | — | — | — | — | Candidate for power strip |
| Home office | — | — | — | — | — | Check sleep vs off |
| Window AC | — | — | — | measure in season | — | Seasonal load |
Fill it once and it informs both your efficiency choices and your outage plan for years.
Safety notes
- Match the meter’s rating to the load; do not exceed its stated amperage or wattage.
- Never adapt a 240-volt appliance onto a 120-volt meter.
- If a meter, plug, or outlet gets warm, stop and inspect — that is an electrical issue, not a measurement one.
Return to the home energy efficiency hub to apply your measurements across weatherization, standby control, and backup planning.
Sources reviewed
- U.S. Department of Energy, Energy Saver: Estimating Appliance and Home Electronic Energy Use; standby-power guidance
- Lawrence Berkeley National Laboratory: Standby Power reference
Sources reviewed July 14, 2026.